
Toolbars
Toolbars are used to call program commands. These toolbars include:
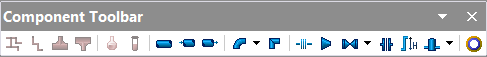
This toolbar is designed to call the main commands of the program.
Button |
Name |
Purpose (program actions) |
|
Create |
Creates a new set of input data |
|
Open |
Opens an input data file (with the .trb extension) and reads data from it. The name of the current source data file is displayed in the title of the program window |
|
Save |
Saves data in the current input data file |
|
Runs a steady-state flow calculation (isothermal flow analysis, diameters calculation or heat and hydraulic analysis) |
|
|
Output of the input data and calculation results for viewing, to file or printing |
|
|
Prints the image in the graphics window on the specified printer |
|
|
Opens the print preview window |
|
|
View and edit the database of insulation and cover layer materials |
|
|
Setting the path to databases and templates of documents with calculation results, setting up the output of graphic information, menus etc. |
|
|
Help |
Calling up the help system of the program |

This panel is designed to call standard project editing commands.
Button |
Name |
Purpose (program actions) |
|
Delete |
Deletes the current object |
|
Cut |
Cuts the current object (pipeline, branch, component etc.) to the clipboard |
|
Copy |
Copies the current object (pipeline, branch, component etc.) to the clipboard |
|
Paste |
Pastes an object from the clipboard |
|
Inserting a node into an existing pipeline (via the graphics window) |
|
|
Reverse Direction |
Reverses the direction of the current branch without changing the pipeline configuration |
|
Merges straight pipes sections located next to each other, having the same direction in space and the same parameters of location and operation |
|
|
Undo |
Undoes previously performed operations |
|
Redo |
Re-executes previously undone operations |
This panel is designed to add new elements to the piping model – pipelines, branches and piping components, fluid components, etc.
Button |
Name |
Purpose (program actions) |
|
Adding a new pipeline |
|
|
Adding a new branch |
|
|
Adding a new tee |
|
|
Adding a new steam trap |
|
|
Adding a new (second/third) fluid (required for calculations of two-phase "frozen" flow, as well as three-phase liquid-liquid-gas mixtures) |
|
|
Adding a new component to the fluid |
|
|
Adding a new straight pipe (Ctrl+1) |
|
|
Adding a new pipe entrance (Ctrl+2) |
|
|
Adding a new pipe exit (Ctrl+3) |
|
|
Adding a new bend or elbow (Ctrl+4) |
|
|
Adding a new flow turn (Ctrl+5) |
|
|
Adding a new compensator (expansion joint or loop) (Ctrl+6) |
|
|
Adding a new reducer (Ctrl+7) |
|
|
Adding a new valve (Ctrl+8) |
|
|
Adding a new orifice (Ctrl+9) |
|
|
Adding a new elevation change (Ctrl+0) |
|
|
Equipment |
Adding a new pump, reservoir, waterhammer damper, Component with known loss coefficient or pressure/temperature drop (Ctrl+"-") |
|
Adding new insulation material or cover layer (Ctrl+"=") |
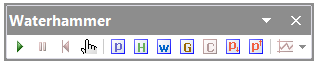
This panel is designed to manage the waterhammer calculation and display its results:
Button |
Name |
Purpose (program actions) |
|
Start or continue |
Starts the calculation of waterhammer or resumes it after a pause |
|
Pause |
Pauses the waterhammer calculation process, with the ability to view current results and then continue the calculation from the current point in time |
|
Restart |
Resets the waterhammer calculation |
|
Point Values |
Allows you to view the value of calculated parameters (pressure, flowrate etc.) at selected point on the piping diagram (only if waterhammer calculation results view is turned on), as well as set, change or delete viewpoints to display the results of the waterhammer calculation in the results list window and in the form of graphs by time |
|
Pressure |
Turns on/off a graphical display of the pressure value on the piping diagram during the waterhammer calculation |
|
Head |
Turns on/off a graphical display of the head value on the piping diagram during the waterhammer calculation |
|
Velocity |
Turns on/off a graphical display of the velocity value on the piping diagram during the waterhammer calculation |
|
Flow rate |
Turns on/off a graphical display of the flowrate value on the piping diagram during the waterhammer calculation |
|
Cavitation volume |
Turns on/off a graphical display of the cavitation volume value on the piping diagram during the waterhammer calculation |
|
Minimum pressure |
Turns on/off a graphical display of the minimum pressure for the entire calculated time of the waterhammer process |
|
Maximum pressure |
Turns on/off a graphical display of the maximum pressure for the entire calculated time of the waterhammer process, as well as the point in the pipeline with the highest pressure value during the waterhammer |
|
Displaying charts of pressure, head, velocity, etc. |
Outputs to Microsoft Excel and opens for viewing the graphs of the change in the corresponding value over time at viewpoints for the entire time since the start of the waterhammer calculation. This function can be used at the moment of pause or completion of the calculation |
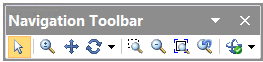
This panel is designed for navigating the piping model in the graphic window.
Button |
Name |
Purpose (program actions) |
|
Mode for selecting a pipeline element on a graph by clicking a mouse button |
|
|
Mode of dynamic zoom by moving the mouse |
|
|
Mode of pan the pipeline model in the plane by moving the mouse |
|
|
Mode of dynamic rotation of the pipeline model around an arbitrary axis or coordinate axes when moving the mouse |
|
|
Mode of zooming by "drawing" a rectangle of the area to zoom in |
|
|
Reduce scale by 2 times while maintaining current center |
|
|
Apply the maximum zoom level at which all pipeline elements are visible in the graphic window |
|
|
Go to the view before the last zoom change |
|
|
Projections of the pipeline model onto coordinate planes, isometric projection |
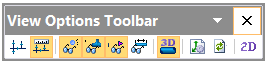
This panel is designed to customize the display of the pipeline graphic diagram.
Button |
Name |
Purpose (program actions) |
|
Simplified scheme |
Enables/disables the simplified diagram mode, in which products are not displayed and all sections have a conditional length |
|
Scaled graphic view |
Enables/disables accounting of pipe lengths when displaying them on the graphics |
|
Node names |
Enables/disables display of pipeline node names in the graphic window |
|
Show all components |
Enables/disables display of all elements except pipes (valves, bends, etc.) in the graphic window |
|
Branches directions |
Enables/disables display of arrows on piping model indicating the direction of the pipeline branches |
|
Pipe lengths |
Enables/disables display of pipe section sizes on the diagram |
|
3D solid representation |
Enables/disables volumetric "solid" 3D display graphics mode |
|
Calls up a dialog for specifying the lengths of element symbols |
|
|
Redraw |
Redraws the pipeline graphic view |
|
Enables/disables 2D graphics mode |
This panel is designed to enable/disable display of calculation parameters on the piping diagram.
Button |
Name |
Purpose (program actions) |
|
Pressure loss |
Turns on/off a graphical display of the pressure losses for piping components on the piping diagram |
|
Pressure |
Turns on/off a graphical display of the pressure for piping components on the piping diagram |
|
Flow |
Turns on/off a graphical display of the flowrate for piping branches on the piping diagram |
|
Temperature |
Turns on/off a graphical display of the temperature for piping components on the piping diagram |
|
Quality |
Turns on/off a graphical display of the fluid vapor quality (mass gas content) of a gas-liquid flow for piping components on the piping diagram |
|
Fluid velocity |
Turns on/off a graphical display of the fluid velocity for piping components on the piping diagram |
|
Heat loss |
Turns on/off a graphical display of the heat loss for piping components on the piping diagram |
|
Flow pattern |
Turns on/off a graphical display of the gas-liquid flow pattern for piping components on the piping diagram |
|
Solid phase |
Turns on/off a graphical display of the solid phase flow pattern (for mixtures of liquids with solid particles) for piping components on the piping diagram |
|
Total hydrates mass percent using PVTSim |
Turns on/off a graphical display of the total mass percentage of the gas-hydrates formation for piping components on the piping diagram (available only if the PVTSim program is available) |


