Waterhammer results window
This window displays the input data and calculation results of the waterhammer surge analysis.
The waterhammer calculation window is synchronized with the Project Tree window, the Object Properties window and other program windows - when you select an element in any of the windows, the focus moves to it in other program windows. At the top of this window there is a drop-down list in which you can select in which presentation options to display the input data/results of the waterhammer calculation. These include:
display of elements with changing state - this presentation mode will show all pipeline elements for which a change in state is specified (valves, pumps), as well as the nature and parameters of the changes (change type, law of change etc.). This presentation mode is convenient to use if you need to quickly find all pumps/valves that are the initiators of the waterhammer transient process;
display of boundary conditions in nodes - this presentation mode displays the boundary conditions in nodes for calculating waterhammer - constant pressure or flow rate (or their change over time), waves reflection in the node, etc. Please note that this presentation mode only displays those pipeline nodes for which the boundary conditions can be specified by the user (for more information on which nodes they are specified for and for which they are initially determined by the calculation method, see here);
display of dampers - if there are waterhammer dampers in the piping model, their list with their main characteristics will be shown in this presentation mode;
display of results by hydraulic components – this presentation mode shows the results of the waterhammer calculation (pressure, head, fluid velocity and flowrate at the current moment of calculation time, as well as the minimum and maximum pressure for the entire elapsed calculation time) for the elements of the current branch. These parameters are updated during the calculation in real time. To view the results for the elements of any other pipeline branch, simply select the element of interest of the piping model in any of the program windows;
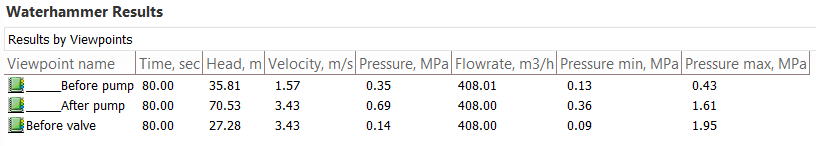
display results by viewpoints — this presentation mode displays the results of the waterhammer calculation (pressure, head, fluid velocity and flowrate at the current moment of calculation time, as well as the minimum and maximum pressure for the entire elapsed calculation time) at viewpoints for the currently selected pipeline element. These parameters are updated during the calculation in real time. Unlike other presentation modes, when displaying results at viewpoints, only those points are displayed that are located in the currently selected piping component. Therefore, to view the parameters of the points of a specific piping component, select it in any of the program windows; if you need to show all viewpoints in a branch, select this branch in the project tree; if you need to display all viewpoints in the pipeline, select the pipeline in the project tree.
Please note that displaying the results at viewpoints and by resistance may be of interest only from the point of view of displaying the maximum/minimum pressures in a given point in the pipeline. The values of other flow parameters (pressure, head, velocity and flow rate) at a particular point in time are usually of no particular interest, since these values may change during the transient process, and quite significantly (the only exception may be cases when it is necessary to determine what values the flow parameters will reach by the end of the transient process - they are conveniently viewed in the waterhammer calculation window when the waterhammer calculation is coming to an end). Therefore, for a more convenient presentation of the waterhammer calculation results, it is recommended to display them in the form of graphs of flow parameter changes over time.