 button of the Main toolbar and
select the report type (or use the corresponding items in the "Analysis"
menu):
button of the Main toolbar and
select the report type (or use the corresponding items in the "Analysis"
menu):Calculation results
After the calculation has been successfully completed, its results can be viewed in several different ways. First of all, the results are displayed in the results list window: for steady-state flow calculations (isothermal flow analysis, diameters calculation and heat and hydraulic calculation) on the tab with the name of the performed calculation (which appears after the calculation has been performed), for waterhammer calculations - on the permanently accessible "Waterhammer results" tab. The structure and content of steady-state flow calculation results are described in detail here, waterhammer calculation - here. Please note that if any changes are made to the input data, the calculation results are immediately reset. Also, the results of the calculations performed are not saved together with the project file, so when opening a previously saved file to view the calculation results in it, it is necessary to repeat the calculation for pipelines.
In addition to viewing the results in the corresponding program windows, they can also be presented in another form:
The
calculation results, as well as the input data, can be printed (in preview,
on the printer or in a file) using the special built-in List & Label
report generator from Combit GmbH. To print the reports, click the button of the Main toolbar and
select the report type (or use the corresponding items in the "Analysis"
menu):
 -
input data;
-
input data;
 -
calculation summary (results by branches);
-
calculation summary (results by branches);
 -
detailed results (by piping components);
-
detailed results (by piping components);
 -
waterhammer results;
-
waterhammer results;
 -
slug flow results (for gas-liquid flow analysis).
-
slug flow results (for gas-liquid flow analysis).
In this case, in the window that appears, you can choose where the report with will be output (to the printer, to the preview, or to PDF, Word, Excel files, etc.) and specify the print settings:
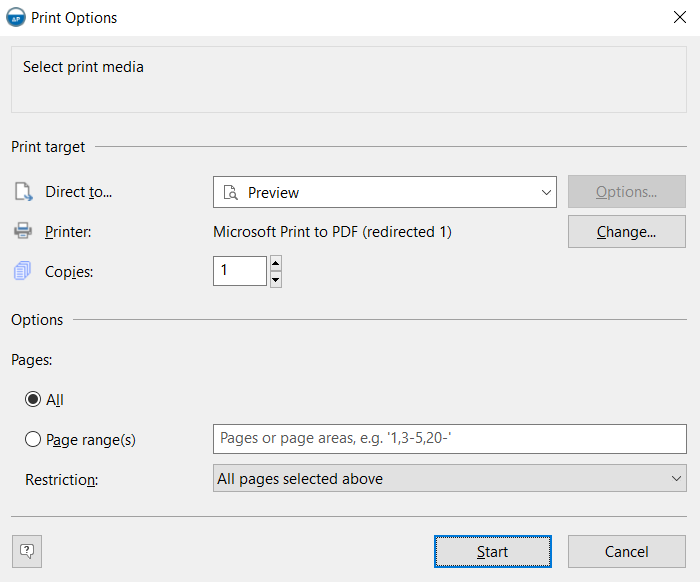
When you click the "Start" button, the report will be generated and displayed.
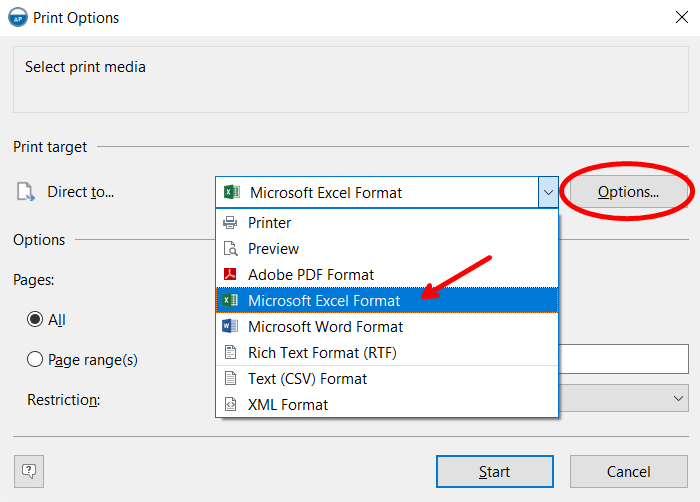
If you need to make any edits to the report, it is most convenient to save it in editable formats (Word or RTF). If you need to send the finished report to someone, it is most convenient to save it in PDF format. If you only need to load the data from the report (without title block and other formatting), for example, to then copy and paste it into your own templates, then when outputting, select the Microsoft Excel format and specify "Only data from table object(s)" in the output options:
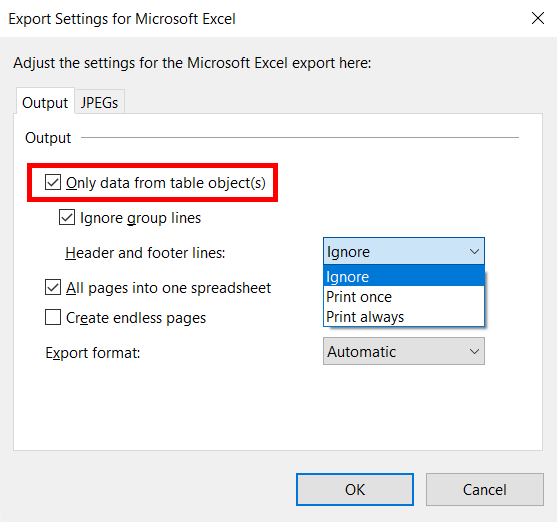
You can enable/disable the output of the document "header" using the "Header and footer lines" option. In addition, similar output settings are also available for other file types (Word, pdf, csv, etc.) - there you can specify the required image output quality, configure encoding and separators (for csv files), configure compression, etc.
The content and design of reports with input data and calculation results can be customized using the program's built-in Form Editor, the operation of which is described here.
Show results on pipeline diagram
The calculated flow parameters (pressure, velocity, temperature, etc.) can be displayed directly on the pipeline diagram. For steady-state flow calculations (isothermal flow analysis, diameters calculation and heat and hydraulic calculation), use the corresponding buttons of the Results View Toolbar (or the corresponding menu items "View - Results Review") to display a parameter of interest:
 -
pressure loss
-
pressure loss
 -
pressure
-
pressure
 - flow rate
(please note that if the branch has a negative flowrate, then by pressing
this button the branch direction arrow changes its direction to the opposite
- that is, it will indicate the direction of the flow in the branch)
- flow rate
(please note that if the branch has a negative flowrate, then by pressing
this button the branch direction arrow changes its direction to the opposite
- that is, it will indicate the direction of the flow in the branch)
 -
temperature
-
temperature
 -
fluid velocity
-
fluid velocity
 - vapor quality
(mass gas content) of a gas-liquid flow
- vapor quality
(mass gas content) of a gas-liquid flow
 -
heat loss
-
heat loss
 -
gas-liquid flow pattern
-
gas-liquid flow pattern
 - solid phase
flow pattern (for mixtures of liquids with solid particles)
- solid phase
flow pattern (for mixtures of liquids with solid particles)
 - total hydrates
mass percent (only if PVTSim program is available)
- total hydrates
mass percent (only if PVTSim program is available)
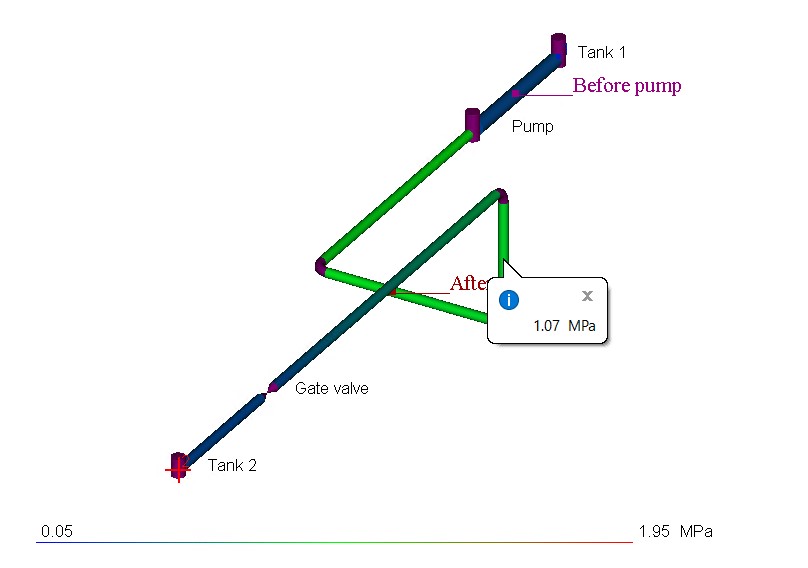
When the corresponding parameter is enabled, the elements of the diagram are colored in different colors, corresponding to the value of the selected parameter. At the bottom of the graphics window, a "legend" is displayed, which can be used to roughly determine which parameter value corresponds to which color. Please note that for each element in the diagram, the value of the selected parameter is shown at the end of this element. Therefore, for example, for long pipes, where the values of pressure, temperature and other flow parameters change significantly, this option for presenting the results may not be very informative (since the entire pipe in the diagram will be of one color, corresponding to the value of the selected flow parameter at the end point of this pipe).
To return to the original view of the diagram (without showing the results), you need to "unpress" the pressed button (of the flow parameter currently shown on the diagram) on the Results View Toolbar by clicking it again.
When calculating a waterhammer, the flow parameters can be visualized on the pipeline diagram in dynamics - i.e., you can monitor the change in their values in the pipeline during the waterhammer calculation. To do this, use the corresponding buttons of the Waterhammer toolbar (or the corresponding menu items "View - Results Review - Waterhammer") to display a parameter of interest:
 -
pressure
-
pressure
 -
head
-
head
 - fluid velocity
 - flow rate
 - cavitation
volume (available only if the cavitation accounting is turned on in the waterhammer
calculation settings)
- cavitation
volume (available only if the cavitation accounting is turned on in the waterhammer
calculation settings)
 -
minimum pressure in the pipeline (shows the point in the pipeline with
the lowest pressure value at the waterhammer)
-
minimum pressure in the pipeline (shows the point in the pipeline with
the lowest pressure value at the waterhammer)
 - maximum pressure
in the pipeline (shows the point in the pipeline with the highest pressure
value at the waterhammer)
- maximum pressure
in the pipeline (shows the point in the pipeline with the highest pressure
value at the waterhammer)
The selected parameter will be dynamically
displayed on the pipeline graphic diagram during the calculation of the
waterhammer, therefore, for convenience (so as not to miss anything),
it is better to first enable the display of the parameter of interest
on the piping diagram, and then start the calculation of the waterhammer.
In addition, at any time during the calculation, you can view the value
of the corresponding parameter at the current time in a specific place
of the pipeline model by activating the "Point Values"  command of the Waterhammer
toolbar and left-clicking on the place of interest in the pipeline
scheme:
command of the Waterhammer
toolbar and left-clicking on the place of interest in the pipeline
scheme:
To return to the original view of the diagram (without showing the results), you need to "unpress" the pressed button (of the flow parameter currently shown on the diagram) on the Waterhammer Toolbar by clicking it again.
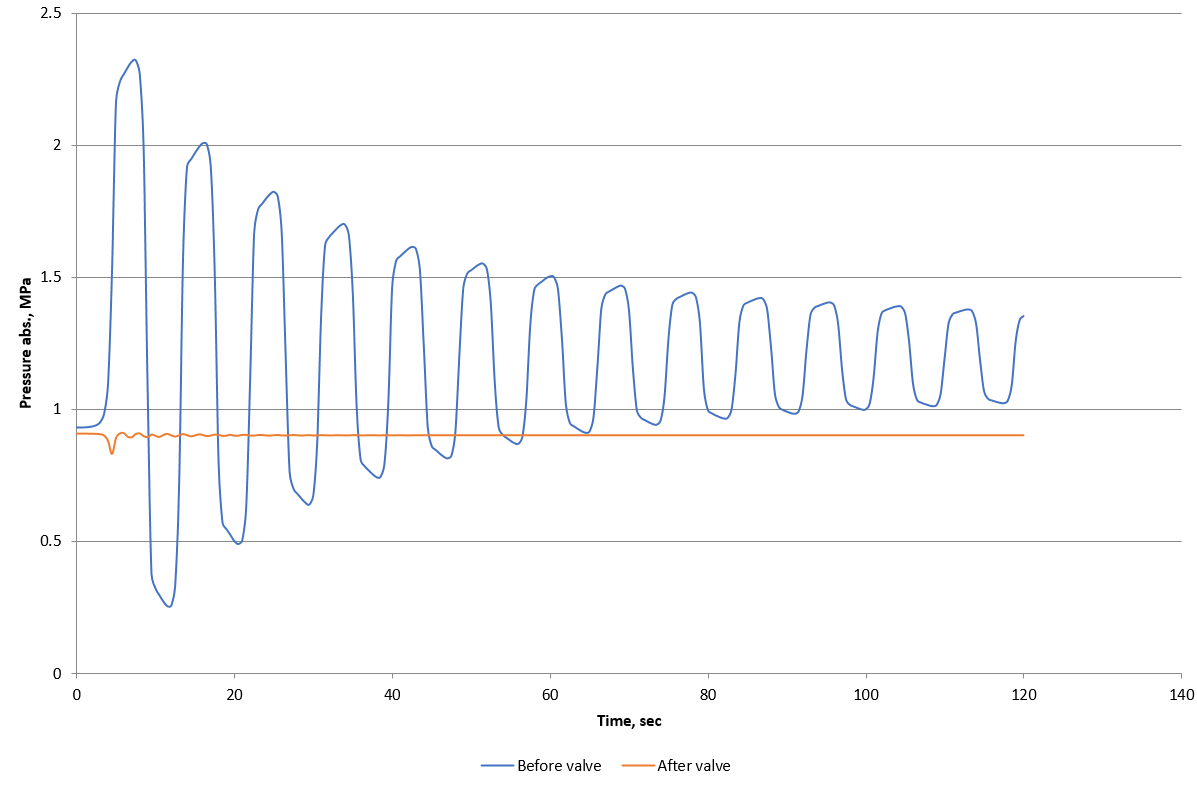
Output of charts with waterhammer calculation results
The results of calculating any transient
process, including the waterhammer, are most conveniently presented in
the form of charts of the change in time of the flow parameters in the
pipeline (pressure, fluid velocity, etc.) at the pipeline points of interest
(the so-called "viewpoints" - for more information on setting
them, see here).
To display such charts in Excel, click the  button of
the Waterhammer toolbar
and select the parameter of interest - head, pressure, velocity, flow
rate, cavitation or force sets (or use the corresponding menu items "Analysis
- Charts at Viewpoints"):
button of
the Waterhammer toolbar
and select the parameter of interest - head, pressure, velocity, flow
rate, cavitation or force sets (or use the corresponding menu items "Analysis
- Charts at Viewpoints"):
The output of cavitation volume graphs is available only if the cavitation accounting is turned on in the waterhammer calculation settings, and the output of force graphs is available only when forces sets tables are specified.
Also, the charts of changes in flow parameters over time are integrated into the report with the results of the waterhammer calculation.
Output of the gas-liquid flow pattern diagram
One of the most important parameters of vapor-liquid flow is the flow pattern, since the stability and reliability of the pipeline system largely depend on it. And when undesirable two-phase flow patterns occur in the pipeline (for example, intermittent flow - plug, slug - which can cause pipeline vibrations), in practice, the main calculation goal is to determine what adjustments need to be made to the operating mode and/or geometry of the pipeline in order to avoid the occurrence of these flow patterns. It is very convenient to analyze this using a special Flow Pattern Map, which can be displayed in the Hydrosystem as follows: after calculating the two-phase gas-liquid (or three-phase gas-liquid-liquid) flow, you must turn on the display of flow patterns on the diagram (see above) and click the pipe of interest in the graphics window - th flow pattern map for this pipe will appear:
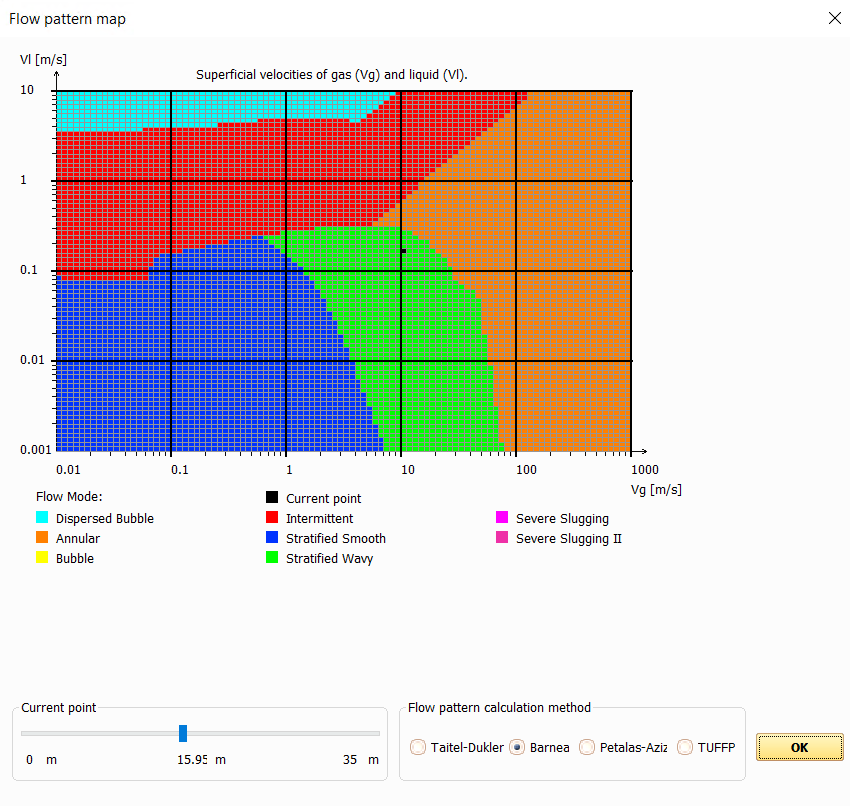
The flow pattern map is plotted in logarithmic coordinates superficial liquid velocity (along the Y axis) vs. superficial gas velocity (along the X axis) in m/s. Different flow patterns are indicated in different colors on the diagram; the current flow pattern in the pipe is marked with a black dot. At the bottom of the window, you can select the flow pattern calculation methods for plotting the map (for more information on these methods, see here) and, using a special "slider", specify at what point relative to the beginning of the pipe this map should be displayed (this can be useful for very long pipes, in which the flow pattern can change along the flow).
Please note that the flow pattern map is displayed only for straight pipe sections and only in the case where there is a two-phase flow throughout the whole section. For piping sections with a completely liquid or gaseous flow, as well as for sections with phase transitions, this diagram is not displayed.