Working
with graphics
Navigating the pipeline
model
To
navigate the graphic pipeline model in the Hydrosystem, traditional commands
are provided, similar to which can be found in almost any program that
works with three-dimensional models of any objects. These commands are
contained in the Navigation
toolbar and in the "Navigate" menu, they
include:
 - this command
activates the mode of selecting piping components in the graphic window
by clicking on them with the left mouse button. This command is selected
by default so there's no need to click it to be able to select piping
components, but sometimes this command may be needed, for
example, when the "Insert node" or "Point Values"
commands has been activated, after which you need to return back to the
selection mode;
- this command
activates the mode of selecting piping components in the graphic window
by clicking on them with the left mouse button. This command is selected
by default so there's no need to click it to be able to select piping
components, but sometimes this command may be needed, for
example, when the "Insert node" or "Point Values"
commands has been activated, after which you need to return back to the
selection mode;
 -
dynamic zoom. It can be done either by activating this command and moving
the mouse cursor up/down while holding down the left mouse button in the
graphics window, or by more familiar way - by rotating the mouse wheel.
In this case, zooming in/out occurs relative to the point in the graphics
window where the cursor is located. If necessary, you can invert the direction
of rotation of the mouse wheel when scaling using the corresponding option
in the program
settings;
-
dynamic zoom. It can be done either by activating this command and moving
the mouse cursor up/down while holding down the left mouse button in the
graphics window, or by more familiar way - by rotating the mouse wheel.
In this case, zooming in/out occurs relative to the point in the graphics
window where the cursor is located. If necessary, you can invert the direction
of rotation of the mouse wheel when scaling using the corresponding option
in the program
settings;
 -
pan the pipeline model in the plane. This can be done either by activating
this command and moving the mouse cursor while holding down the left mouse
button in the graphics window, or by the more familiar - by clicking and
holding the mouse wheel and moving the cursor in the graphics window;
-
pan the pipeline model in the plane. This can be done either by activating
this command and moving the mouse cursor while holding down the left mouse
button in the graphics window, or by the more familiar - by clicking and
holding the mouse wheel and moving the cursor in the graphics window;
 - dynamic rotation.
The pipeline model can be rotated either around the X, Y or Z coordinate
axes, or around an arbitrary axis. To rotate, select the desired axis,
then press and hold the left mouse button and move the cursor in the graphics
window. Rotation around an arbitrary axis can also be activated by pressing
and holding the Shift key and the mouse wheel and moving the cursor in
the graphics window;
- dynamic rotation.
The pipeline model can be rotated either around the X, Y or Z coordinate
axes, or around an arbitrary axis. To rotate, select the desired axis,
then press and hold the left mouse button and move the cursor in the graphics
window. Rotation around an arbitrary axis can also be activated by pressing
and holding the Shift key and the mouse wheel and moving the cursor in
the graphics window;
 -
static zoom in. To zoom in on any part of the graphics, you can activate
this command and "draw" in the graphics window a rectangle of
the area (holding down the left mouse button) that you want to zoom in
on;
-
static zoom in. To zoom in on any part of the graphics, you can activate
this command and "draw" in the graphics window a rectangle of
the area (holding down the left mouse button) that you want to zoom in
on;
 - static zoom
out. When you click this button, the scale of the diagram is reduced by
half while maintaining the current center of the view;
- static zoom
out. When you click this button, the scale of the diagram is reduced by
half while maintaining the current center of the view;
 - fit all. When
you click this button, the pipeline model "fits" into the graphics
window, i.e. it is centered and reduced to such a scale that all elements
of the pipeline without exception fit into the graphics window. This operation
can also be performed by double-clicking the mouse wheel in the graphics
window;
- fit all. When
you click this button, the pipeline model "fits" into the graphics
window, i.e. it is centered and reduced to such a scale that all elements
of the pipeline without exception fit into the graphics window. This operation
can also be performed by double-clicking the mouse wheel in the graphics
window;
 -
previous view. When you click this button, you return to the previous
static representation of the pipeline in the graphics window;
-
previous view. When you click this button, you return to the previous
static representation of the pipeline in the graphics window;
 -
projections. Using this option, you can present the pipeline model as
projections on various coordinate planes and as an isometric representation.
The latter is especially convenient in cases where, after rotating the
diagram, it is necessary to return it to its original form.
-
projections. Using this option, you can present the pipeline model as
projections on various coordinate planes and as an isometric representation.
The latter is especially convenient in cases where, after rotating the
diagram, it is necessary to return it to its original form.
Setting up the display
detail of the pipeline model
For
a more convenient presentation of the pipeline model in the Hydrosystem,
there is the ability to enable/disable the display of certain elements
of the pipeline representation, take into account the sizes of the elements,
etc. These commands are contained in the View
Options Toolbar and in the menu "View - Graphic
View Options", they include:
 - Scaled graphic view. This
option enables/disables accounting of pipe lengths when displaying them
on the graphics. By default, all pipeline sections are displayed according
to the lengths specified for them in input data. However, if you disable
this option, the pipe sections will be displayed in graphic window as
segments of the same length, regardless of the lengths specified for them
in the input data. This can be convenient, for example, when working with
very long pipelines, in which, with the scaled graphic view enabled, when
zooming out (so that the entire pipeline fits in the window), it is difficult
to see various "small" elements (valves, orifices, etc.). The
conventional length with which pipes are displayed in graphic window when
the scaled view is disabled can, if necessary, either be configured in
"Component lengths" (see below), or individually changed for
each pipe section in the graphic window (for more information on these
and other options for graphic editing of the pipeline, available when
the scaled view is disabled, see here);
- Scaled graphic view. This
option enables/disables accounting of pipe lengths when displaying them
on the graphics. By default, all pipeline sections are displayed according
to the lengths specified for them in input data. However, if you disable
this option, the pipe sections will be displayed in graphic window as
segments of the same length, regardless of the lengths specified for them
in the input data. This can be convenient, for example, when working with
very long pipelines, in which, with the scaled graphic view enabled, when
zooming out (so that the entire pipeline fits in the window), it is difficult
to see various "small" elements (valves, orifices, etc.). The
conventional length with which pipes are displayed in graphic window when
the scaled view is disabled can, if necessary, either be configured in
"Component lengths" (see below), or individually changed for
each pipe section in the graphic window (for more information on these
and other options for graphic editing of the pipeline, available when
the scaled view is disabled, see here);
 - Node names. This option
enables/disables display of pipeline node names in the graphic window.
To change the font used to display node names, use the corresponding option
in menu "View - Graphic View Options - Fonts";
- Node names. This option
enables/disables display of pipeline node names in the graphic window.
To change the font used to display node names, use the corresponding option
in menu "View - Graphic View Options - Fonts";
 - Show all components. This
option enables/disables display of all elements except pipes (valves,
bends, etc.) in the graphic window. Please note that when disabling this option, the directions
of pipes, specified using projections of their lengths on the X, Y and
Z axes, are not taken into account on the graphic view! This
option, or rather its disabling, is convenient if you need to present
the pipeline model as an oriented graph for a more visual display of the
relationship between the pipeline branches;
- Show all components. This
option enables/disables display of all elements except pipes (valves,
bends, etc.) in the graphic window. Please note that when disabling this option, the directions
of pipes, specified using projections of their lengths on the X, Y and
Z axes, are not taken into account on the graphic view! This
option, or rather its disabling, is convenient if you need to present
the pipeline model as an oriented graph for a more visual display of the
relationship between the pipeline branches;
 - Branches direction. This
option enables/disables display of arrows on piping model indicating the
direction of the pipeline branches. Please note that the direction of
flows in the branches does not always coincide with the direction of the
branches themselves (more about this here);
- Branches direction. This
option enables/disables display of arrows on piping model indicating the
direction of the pipeline branches. Please note that the direction of
flows in the branches does not always coincide with the direction of the
branches themselves (more about this here);
 - Pipe lengths. This option
enables/disables displaying the lengths of pipe sections opposite each
of them in the graphic window;
- Pipe lengths. This option
enables/disables displaying the lengths of pipe sections opposite each
of them in the graphic window;
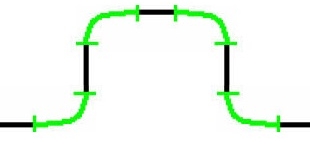
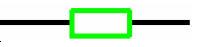
 - 3D solid representation.
This option allows you to switch between the "traditional" isometric
representation of the pipeline model (in which pipes are displayed as
thin lines, and all other elements as symbols) and the volumetric "solid"
3D display. For different types of pipeline systems, both the first and
second options may be convenient;
- 3D solid representation.
This option allows you to switch between the "traditional" isometric
representation of the pipeline model (in which pipes are displayed as
thin lines, and all other elements as symbols) and the volumetric "solid"
3D display. For different types of pipeline systems, both the first and
second options may be convenient;
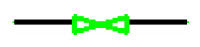
 - Simple scheme. This option
allows you to switch between the "normal" graphical presentation
of the pipeline (in which all pipeline elements are displayed and all
sections are drawn according to their lengths) and the "simplified"
mode, in which the sizes of piping sections are not taken into account
at pipeline graphical representation and the piping components (valves,
bends, etc.) are not shown. In fact, enabling/disabling this option is
equivalent to simultaneously enabling/disabling the "scale graphic
view" and "show all components" options;
- Simple scheme. This option
allows you to switch between the "normal" graphical presentation
of the pipeline (in which all pipeline elements are displayed and all
sections are drawn according to their lengths) and the "simplified"
mode, in which the sizes of piping sections are not taken into account
at pipeline graphical representation and the piping components (valves,
bends, etc.) are not shown. In fact, enabling/disabling this option is
equivalent to simultaneously enabling/disabling the "scale graphic
view" and "show all components" options;
 - Redraw. When you click
this button, the piping model is redrawn in the graphic window taking
into account the latest changes in the input data. This command is obsolete
and is not used in the latest versions of the program, since the graphic
is updated automatically in the latest versions.
- Redraw. When you click
this button, the piping model is redrawn in the graphic window taking
into account the latest changes in the input data. This command is obsolete
and is not used in the latest versions of the program, since the graphic
is updated automatically in the latest versions.
All
the above settings are saved when you exit the program. Please note that
these settings relate exclusively to the graphical representation of the
pipeline model and do not in any way affect the pipeline calculation.
Graphic editing of
the pipeline model
In
some cases, it may be necessary to change the sizes of pipeline elements
on the graphics, move its nodes, etc. For this case, the Hydrosystem provides
various graphic editing tools. These include:
rotation of bends, elbows and
tees - by right-clicking on any of these
elements, the "Rotate" command will be available, with which
you can change the orientation in space of this and all the following
elements to the opposite (note that this command may not work in closed
loops). However, this command is somewhat outdated and is rarely used
in the latest versions of the program, since the orientation of elements
in space is much easier and more convenient to control by setting
the corresponding projection values for them on the coordinate axes;
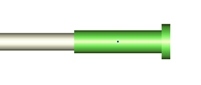
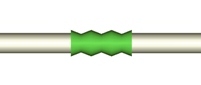
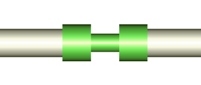
changing
the sizes of "point" elements - such elements
as valves, tees, orifices, etc. are considered "point" from
a hydraulic point of view, i.e. they have no dimensions. On graphics,
such elements are displayed with certain conventional dimensions,
which can be changed if necessary. If you need to change the sizes
of any individual piping component, you need to right-click on it
in the graphics window, select the "Stretch" command in
the context menu and rotate the mouse wheel (or hold down the left
mouse button and move the cursor up/down) to decrease/increase its
conventional length of this component. If you need to change the sizes
of all components of a given type at once, click the "Component
Lengths" button  in the View
Options Toolbar (or use the corresponding menu command
"View - Graphic View Options") and specify the desired element
sizes in the window that appears:
in the View
Options Toolbar (or use the corresponding menu command
"View - Graphic View Options") and specify the desired element
sizes in the window that appears:
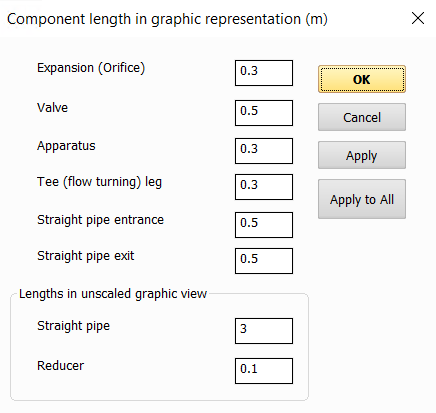
When
you click the "Apply" button in this window, these dimensions
will be applied to all pipeline elements except those for which these
dimensions were changed manually (using the "Stretch" command),
when you click the "Apply for All" button - to all elements
of this type without exception (including those for which the dimensions
were changed individually). If you simply click the "OK" button
without clicking the "Apply" or "Apply for All" buttons
beforehand, these changes will not affect existing pipeline elements,
but all newly added elements will have the specified lengths by default.
Note: When importing piping
models (from PCF, XML, etc. files), the lengths of the elements are considered
as previously modified, so their dimensions on graphics will not change
when you click the "Apply" button.
Please note that when the scale representation
is enabled, the graphical subsystem by default works in such a way that
changing the sizes of point elements does not affect the overall length
of the pipeline. Their sizes are sort of "superimposed" on the
adjacent pipe sections, so when the sizes of such elements are changed,
the positions of all other elements in the pipeline do not change. This
approach exactly corresponds to the physical interpretation of "point"
elements in hydraulic calculations (as mentioned above, in hydraulic calculations
they are considered as dimensionless elements that have no lengths), so
it is used in the program by default. However, if necessary, this "ideology"
can be changed by disabling the "Precise graphic representation of
scaled view" option in the program settings (menu
"Tools - Options..."). In this case, the sizes of "point"
elements will affect the overall length of the pipeline - when changing
the sizes of such elements, they will sort of "move away/move closer"
to the adjacent elements of the piping model. However, this version of
the piping representation may be inaccurate when modeling pipelines with
closed loops. If the scale representation is disabled, the dimensions
of the "point" elements affect the overall length of the pipeline
regardless of whether the "Precise graphic representation of scaled
view" option is enabled;
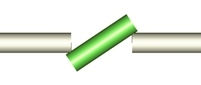
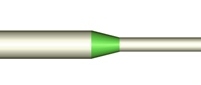
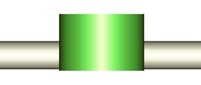
changing
the conventional lengths of pipes and reducers - when
the "Scaled graphic view" option is enabled, this function
does not work, since in this mode the pipes and reducers are displayed
with the dimensions that are specified for them in the input data.
But when "Scaled graphic view" is disabled, the conventional
lengths of pipes and reducers, with which they are displayed on graphics,
can be changed. To do this, right-click on the corresponding element
in the graphics window, select the "Stretch" command in
the context menu and rotate the mouse wheel (or hold down the left
mouse button and move the cursor up/down) to decrease/increase the
size of this element. You can change the sizes of all pipes/reducers
in pipeline using the "Component Lengths" command of the View
Options Toolbar, similar to how it is shown above for other
piping components;
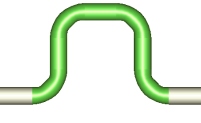
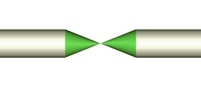
moving
nodes in graphics in the direction of one of the branches -
when the "Scaled graphic view" option is enabled, this function
does not work, since in this mode, pipes and reducers are displayed
with the dimensions that are specified for them in the input data,
and accordingly, the positions of all nodes on the graphic view of
piping model are fixed. But when "Scaled graphic view" is
disabled, the positions of pipeline nodes can be changed. To do this,
right-click on the corresponding node in the graphics window, select
the "Shift" command in the context menu and rotate the mouse
wheel (or hold down the left mouse button and move the cursor up/down)
to move this node. The sizes of all elements of the branch along the
direction of which it is moving will proportionally increase/decrease
in the graphic window.
Please
note that all the above operations relate exclusively to the graphical
representation of the pipeline model and in no way affect the calculation
of the pipeline.
In
addition, when working with the pipeline model in the graphics window,
you can select various fragments of the pipeline model (consisting of
several elements or several branches or pipeline segments from one node
to another) for their subsequent copying/pasting and deletion. These operations
are described in more detail here.
2D graphics
mode and working with background image
The Hydrosystem provides the ability
to view and edit the pipeline model in 2D representation mode of two-dimensional
graphics. Switching between the traditional three-dimensional isometric
view and the 2D mode is done using the button  of the View
Options Toolbar (or the corresponding menu option "View
- Graphic View Options"). Visually, the 2D mode is similar to the
pipeline presentation as a projection onto the XY plane (i.e., a top view),
but unlike the usual projection display, in the 2D mode, there is an option
to add a background image in the graphics window upon which the piping
model is drawn and the
ability to edit the sizes of pipeline elements directly on the graphics.
To display the background image, you need to:
of the View
Options Toolbar (or the corresponding menu option "View
- Graphic View Options"). Visually, the 2D mode is similar to the
pipeline presentation as a projection onto the XY plane (i.e., a top view),
but unlike the usual projection display, in the 2D mode, there is an option
to add a background image in the graphics window upon which the piping
model is drawn and the
ability to edit the sizes of pipeline elements directly on the graphics.
To display the background image, you need to:
Enable
2D mode;
Enable display of the background in the menu
"View - Graphic View Options";
Select
the root element (project) in the project tree and load the background
image file into the program in the corresponding field of the Object
Properties Window;
Set
the background scale by specifying the width and height of the entire
background map:
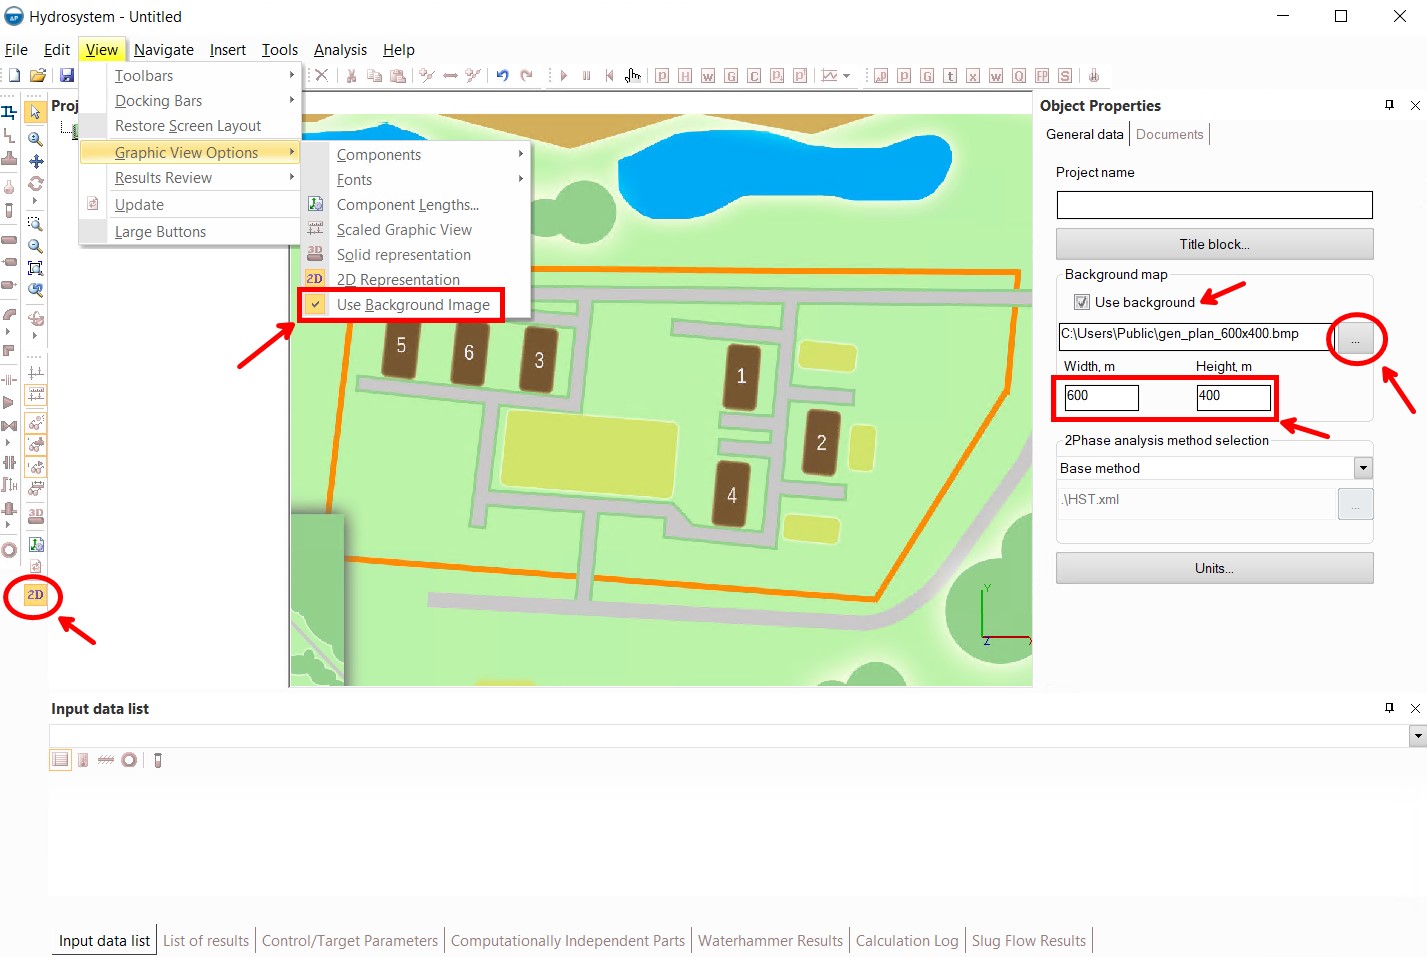
Currently,
Hydrosystem only supports .bmp and .dib format backgrounds, however, as
a rule, backgrounds of any other formats can be easily converted to .bmp
files using special converter programs, as well as various online file
conversion services, which are available in large quantities on the Internet.
Building
a pipeline model on a background is in many ways similar to "regular"
pipeline modeling (it is necessary to add branches, pipe sections, valves,
fittings, etc. to the pipeline in the same way), except that in this mode
you can move pipeline nodes in the graphic window (by selecting a node
on the diagram and moving the cursor while holding down the left mouse
button), thereby "pulling" the pipe sections between them. The
program will calculate the lengths of the pipe section projections (as
well as the parameters of the adjacent branches) automatically, based
on the specified scale of the background. Therefore, when working with
the background, be sure that the "Scaled graphic view" of the
pipeline is enabled in the graphics parameters
and that the width and height of the background are set correctly (otherwise
it will be impossible to correctly calculate the lengths of the pipe sections,
as a result of which the use of the 2D mode loses its meaning).
An
example of modeling a pipeline on a background can be seen in the training
video at the link below:
https://youtu.be/sngRaeDQUHI?si=oCjSnCkZ2MACcT2p
In
addition, the 2D mode can be used without a background - editing the pipeline
model in this case works similarly (however, you will have to move nodes
on the diagram "blindly").
Displaying
names of nodes and elements on the pipeline model
By default, in the graphics window
for pipeline only node numbers are displayed, but you can also display
the names of individual nodes and piping components. To do this, you just
need to assign a name to a node (for more information on how to do this,
see here),
and for a piping component (pipe, equipment, valve, etc.), you need to
enter the desired name and enable its display on graphics (this is described
in detail here).
To set the font in which these names will be displayed, use the corresponding
menu option "View - Graphic View Options - Fonts".
Printing
graphics
To print the graphic view on a
printer or to a file (PDF or similar), click
the  button of the Main toolbar or
use the corresponding option in the File menu. The piping diagram is printed
in the form in which it is currently displayed in the graphics window
(i.e. if a particular fragment of the diagram is zoomed in on the graph,
only it will be printed, and not the entire pipeline model). In addition
to the pipeline diagram itself, a title is also displayed, including the
pipeline name and the print date. Please note that this method of outputting
a graphic model is only suitable for more or less simple pipelines or
fragments of complex pipelines. Complex and extended pipelines may not
look detailed enough and too small when printed, due to the limited size
of the print format. Therefore, to output complex and extended piping
models with greater detail and better
resolution, it is recommended to use the export to DXF format
or generate
a drawing in AutoCAD.
button of the Main toolbar or
use the corresponding option in the File menu. The piping diagram is printed
in the form in which it is currently displayed in the graphics window
(i.e. if a particular fragment of the diagram is zoomed in on the graph,
only it will be printed, and not the entire pipeline model). In addition
to the pipeline diagram itself, a title is also displayed, including the
pipeline name and the print date. Please note that this method of outputting
a graphic model is only suitable for more or less simple pipelines or
fragments of complex pipelines. Complex and extended pipelines may not
look detailed enough and too small when printed, due to the limited size
of the print format. Therefore, to output complex and extended piping
models with greater detail and better
resolution, it is recommended to use the export to DXF format
or generate
a drawing in AutoCAD.
To
preview the print, click the  button
of the Main toolbar
or use the
corresponding command
from the File menu. If necessary, you can set the default
printer using the "Print Setup..." command from the File menu.
button
of the Main toolbar
or use the
corresponding command
from the File menu. If necessary, you can set the default
printer using the "Print Setup..." command from the File menu.
Piping
components icons used on graphics
The table below provides a list of
available pipeline components in the Hydrosystem and the graphic icons
used for them: