Export of the isometric drawing to AutoCAD
The program provides the ability to export a 3D solid model of a pipeline (with automatic and manual dimensioning and tagging) and the main results of its calculation in AutoCAD. To use this feature, you must have AutoCAD version 2020 or newer installed on your computer.
Installation
1. Open the Hydrosystem installation directory (by default C:\Program Files (x86)\truboprovod\hst_eng), copy the “HstHydroISO” folder in it and paste it into the C:\Users\<User>\Documents directory (where <User> – Windows user account name).
2. Open the AutoCAD configuration file C:\Program Files\Autodesk\AutoCAD 2024\Support\en-us\acad2024doc.lsp in a text editor (for example, Notepad) with administrator rights (depending on the version and language of the version of AutoCAD you are using, instead of “2024” there may be “2021”, “2022”, etc., and instead of “en-us” - “fr-FR”, “es-ES” etc.).
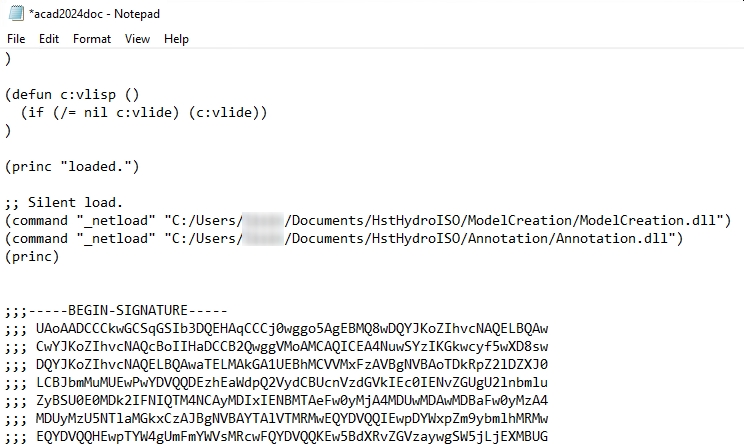
3. In this file, find the line ;; Silent load and after it add links to two .dll files of the drawing export module (substituting the name of the Windows user account instead of <User>):
(command "_netload" "C:/Users/<User>/Documents/HstHydroISO/ModelCreation/ModelCreation.dll")
(command "_netload" "C:/Users/<User>/Documents/HstHydroISO/Annotation/Annotation.dll")
4. Save changes to a file.
5. In the directory C:\Users\<User>\Documents there is a template file HstTemplate.dwt, which you can make changes to if necessary (except for the file structure and layer names).
6. Launch AutoCAD - if the module is installed successfully, after launching AutoCAD, the following messages will appear sequentially prompting you to load the module files:
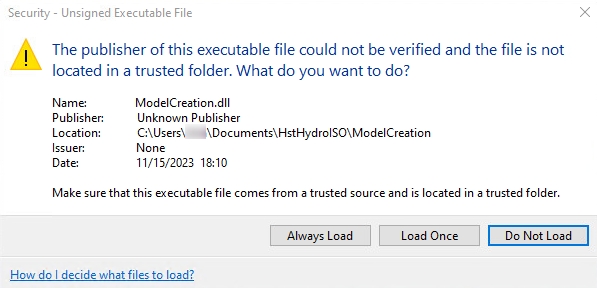
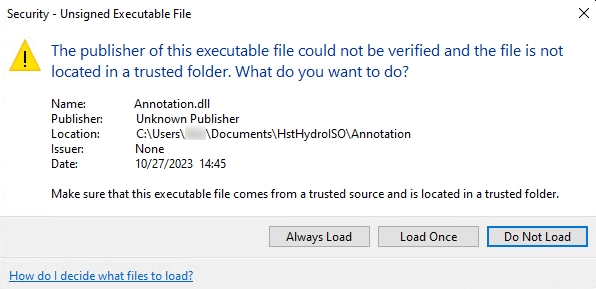
It is recommended to click “Always Load” in both windows so that you do not have to repeat this procedure in the future.
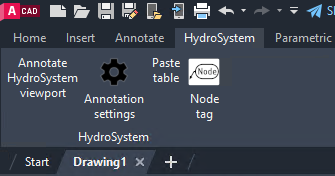
In AutoCAD the “HydroSystem” tab should appear in the main menu - this means that the installation of the module was successful and you can start generating drawings from Hydrosystem (AutoCAD can then be closed - when the drawing is output, it will be called automatically):
Drawings generation
To generate a drawing, you need to run a pipeline calculation (isothermal, heat and hydraulic etc.) in Hydrosystem, and then use the “Isometric Drawing...” option in the “File” menu. This will launch AutoCAD and display the message “HydroISO creation started…” in the lower right corner of the Hydrosystem window. While creating a drawing, the AutoCAD window may “blink” on the taskbar for some time; this process takes some time, please, wait. After successful export, the message “HydroISO creation completed…” will appear in the lower right corner of the Hydrosystem window.
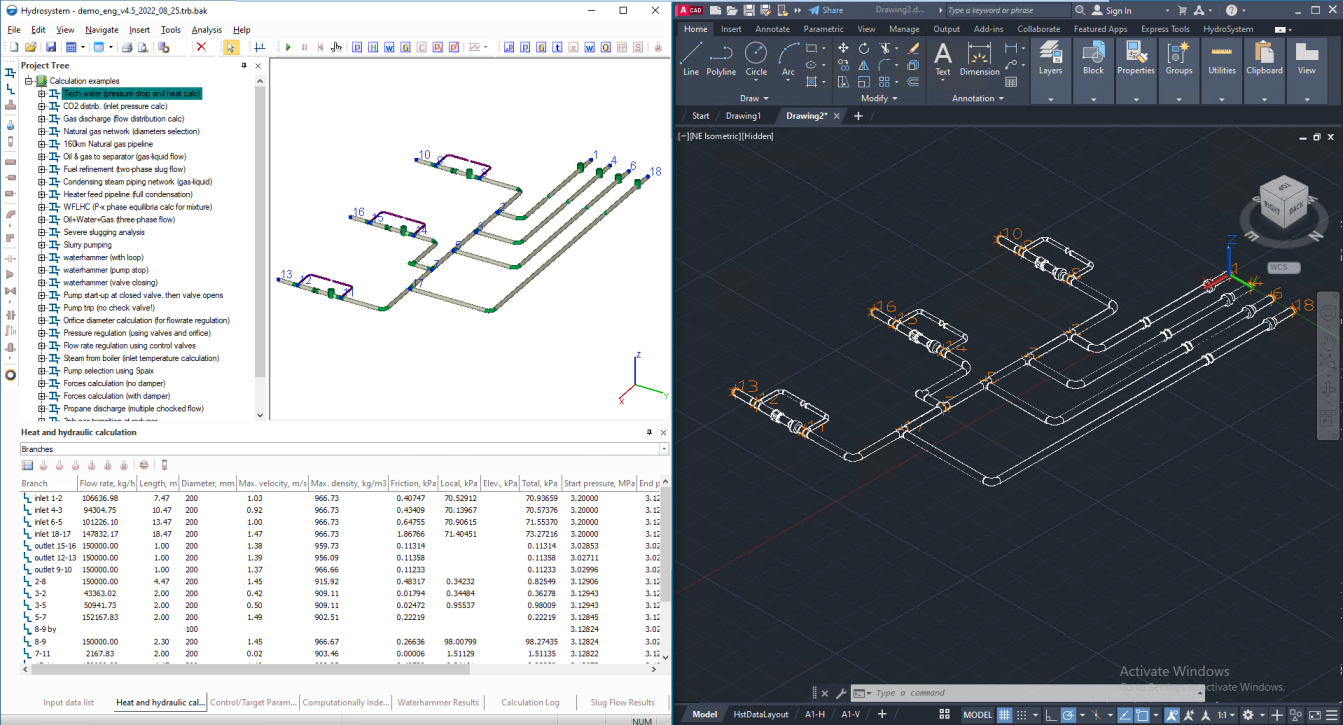
The piping components will be created as blocks with attributes. For convenience, all model elements are grouped into layers.
Attention! The contents of the HstDataLayout sheet should not be changed. This sheet is used to store additional information necessary for correct work with the model.
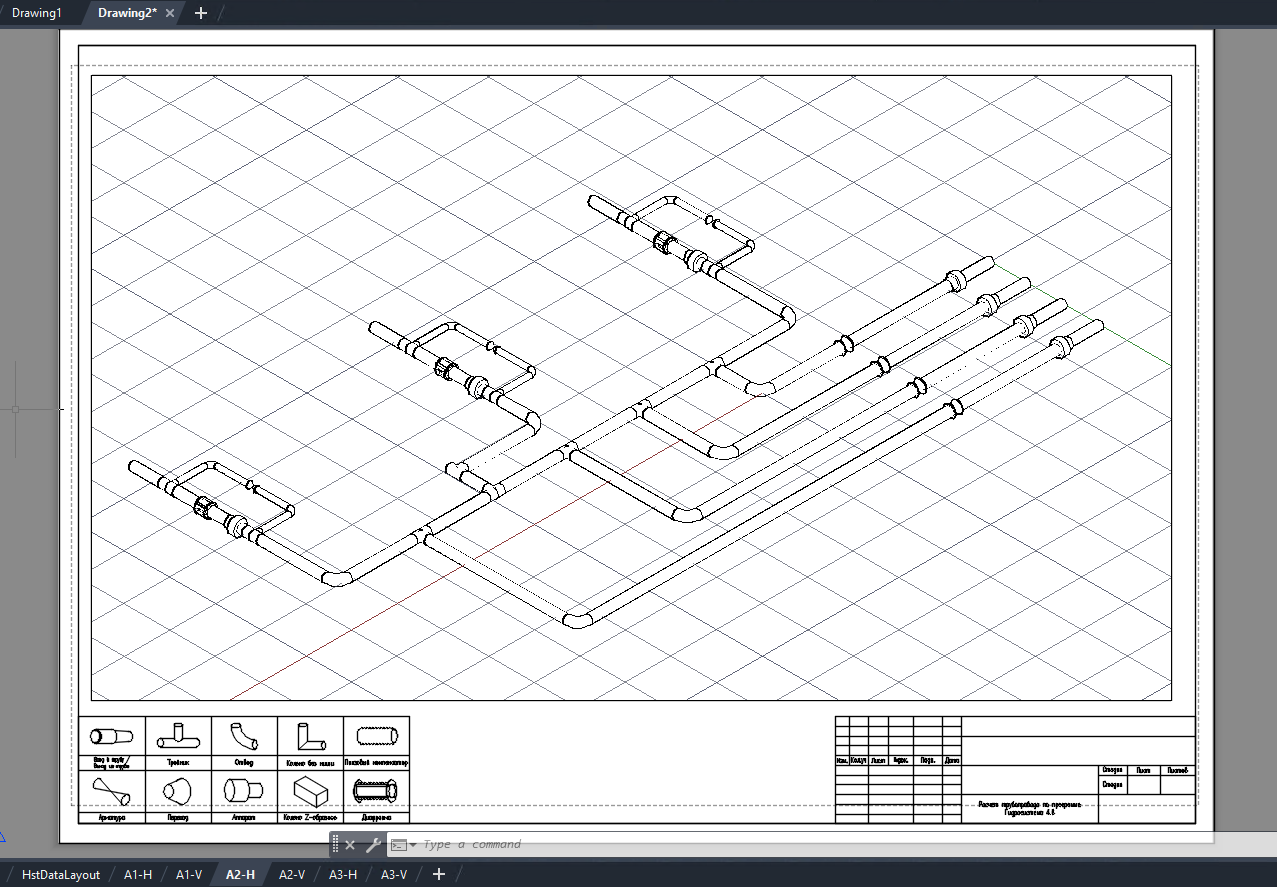
You can insert viewports on drawing sheets - to do this you need to: open one of the sheets of the required format (A1-H, A1-V, A2-H, etc.), enter in the command line the VPORT command (confirming the entry by pressing the Enter button), in the “Viewports” window that appears, select the required view configuration and click “OK”, then select the area on the sheet where you want to add this viewport:
Using the "Annotate viewport" button on the "HydroSystem" tab in the AutoCAD menu, you can add annotations on viewports (labels of pipeline elements and nodes, as well as dimensions - the set of annotations can be configured by clicking on the "Annotation settings" button) for piping elements. To do this, click this button, select the required viewport and confirm adding annotations with the Enter key.
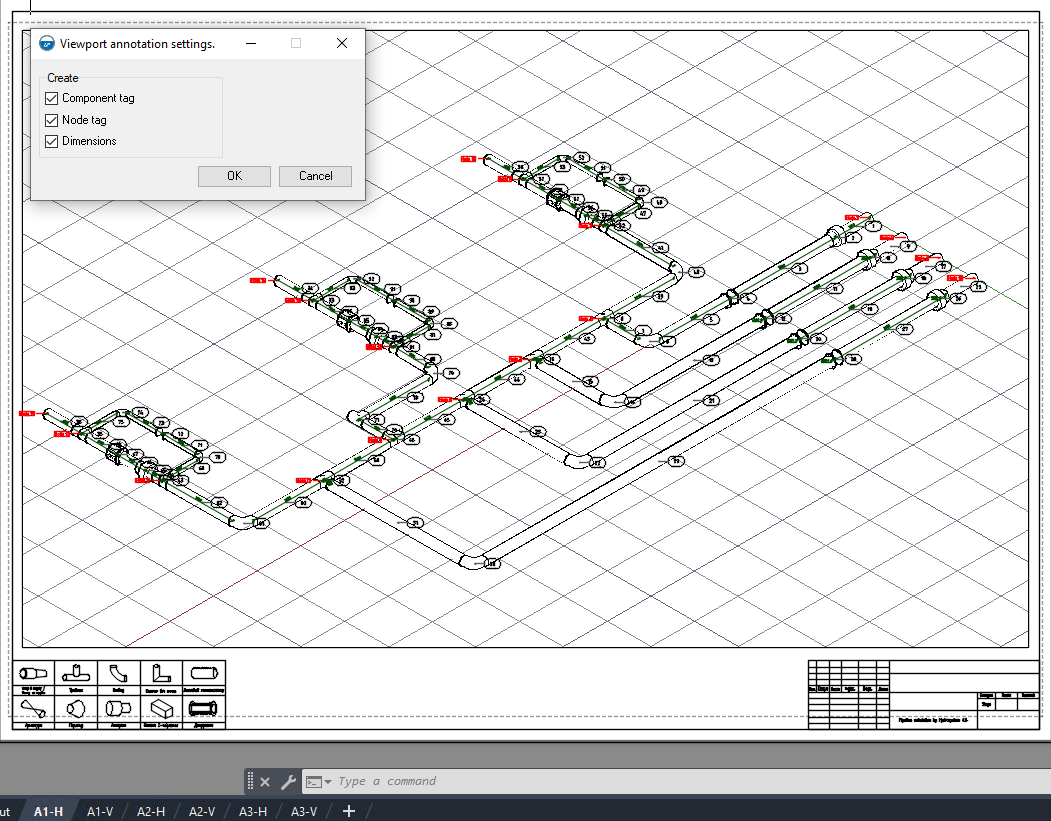
The resulting annotations can then be moved to make the drawing easier to read. If you want to add an annotation for only one or more specific elements, you need to click the "Node tag" button, select the object of interest in the viewport and confirm the entry of the annotation by pressing the Enter button.
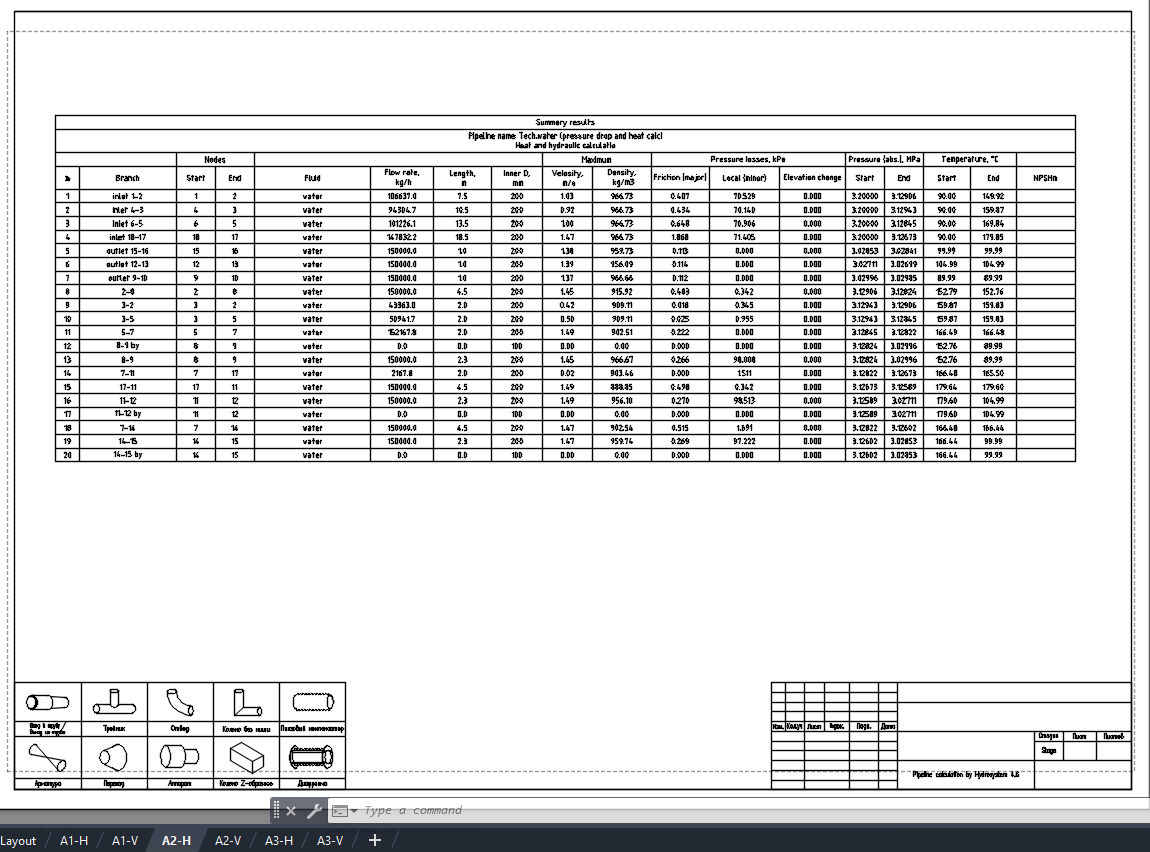
Using the "Paste table" button you can add tables with general data on the pipeline and with the results of calculations on branches:
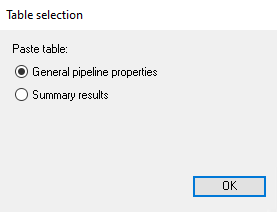
After clicking this button, select the required table and indicate where on the sheet it should be added.