Calculate projected service life for steel industrial pipelines based on fatigue strength and corrosion wear. This determines safe operating time under specified loading conditions. Analysis follows GOST 32388-2013 appendices. Calculation methods apply to steel industrial pipelines designed per GOST 32388-2013. Maximum projected service life is 20 years. Overall service life depends on the weakest element. Modify the structure or cross-section of critical elements to increase system life.
Enter element data manually or import from START-PROF files. View results in a printable table format.
Service life analysis includes:
Analysis for maximum operating temperature range
Stress amplitude and equivalent stress proportional to temperature range at maximum operating temperature
Uniform temperature distribution along pipe length
To begin, select File > New
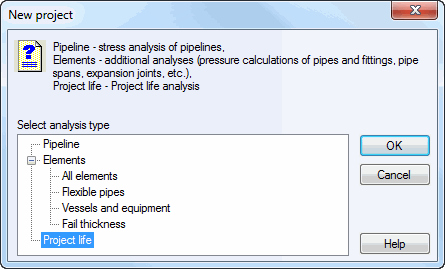
In the New dialog, select "Project Life" (fig. 1) and click OK. The Project Life dialog opens (fig. 2)

Fig. 1
Create a new file or import data from START-PROF sustained loads analysis per GOST 32388-2013. Select "Load data file" and click OK, then specify the ".ctp" file.
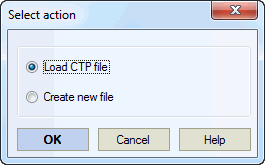
Fig. 2
The conversion table shows:
Element type from START-PROF ".ctp" file;
Node number;
Target element type in START-Service Life
To change element type, select it in the third column and click the appearing button. Choose from available alternatives.
Elements imported from START-PROF appear in the list. Click "Edit" to modify properties. Changes apply to all elements with identical dimensions. Click OK to continue to fig. 5 .
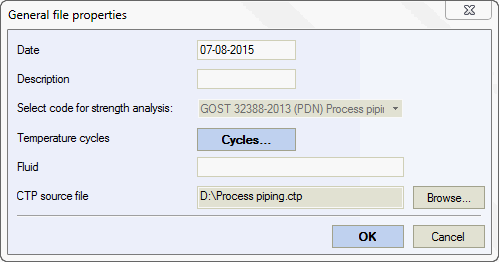
Fig. 5
If no START-PROF file is loaded, click "Browse" to select one.
Enter a keyword in "Product" to search the corrosion database for matching compositions. For example, searching for "water" (fig. 8) finds entries containing "water", "water vapor", "water solution", etc.
Temperature cycles are defined via "Input cycle".
Click OK to continue to fig. 6.
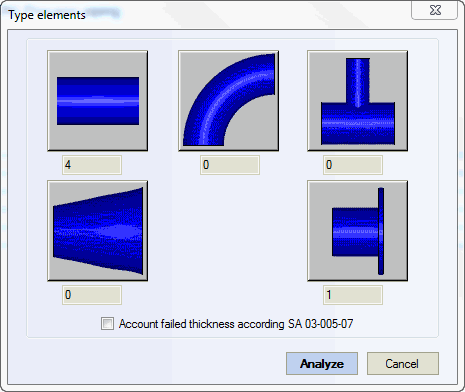
Fig. 6
This window shows available element types. Numbers below icons indicate element counts. New analyses show zero counts.
Check "consider rejection thickness" to use max(td, tmin) as minimum wall thickness for corrosion analysis. Otherwise, use td.
Where
td - design wall thickness for pressure P without corrosion allowance, calculated by START-PROF;
tmin - rejection wall thickness per GOST 32569-2013.
Click an element icon to input data for that element type. For existing elements, data from the first element of that type appears. Fig. 7 shows bend input data.
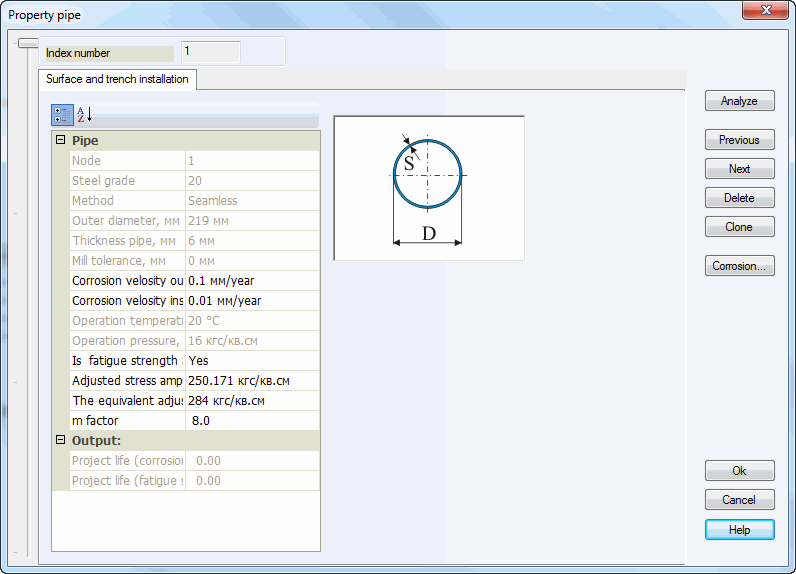
Fig. 7
The left panel lists elements of this type. Use the slider to navigate between them. The top shows current element number and control buttons:
Copy - create new element from current
Delete - remove current element
Previous - previous element
Next - next element
Select the appropriate element type tab and enter all required properties (e.g., elbow, bend, extruded outlet, or miter in fig. 7).
Check "service life for long-term fatigue strength" and enter (see calculation methods):
Equivalent stress amplitude σae at +20°C
Equivalent stress σe at +20°C
Degree m - fatigue stress-time dependence exponent (default: 8)
START-PROF data calculates these values automatically.
Click "Analyze" to calculate and display fatigue-based service life in years. Maximum displayed value is 30 years.
Corrosion-based service life always calculates. You must input corrosion rate. Get corrosion rates from the corrosion database via "Corrosion..." button. The database dialog appears (fig. 8). Select the appropriate product composition. The dialog filters entries matching your keyword, material, and operating temperature range.
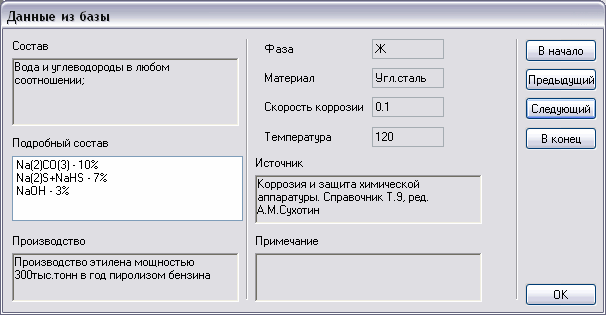
Fig. 8
Click "Analyze" to calculate and display corrosion-based service life. Maximum displayed value is 30 years.
Errors during analysis trigger diagnostic messages and open the problematic element's dialog. Make required changes and click Analyze again or click Close. After successful analysis, the results window appears (fig. 9).
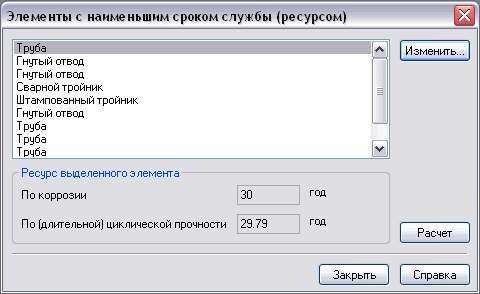
Fig. 9
Elements sort by service life (shortest first). The right panel shows calculated life for selected element. Double-click an element to edit its properties. This opens the element dialog from fig. 7. After changes, click OK to return to results. Edit multiple elements as needed. Click "Analyze" to recalculate and re-sort all elements.
Click "Close" to view final output (fig. 10).
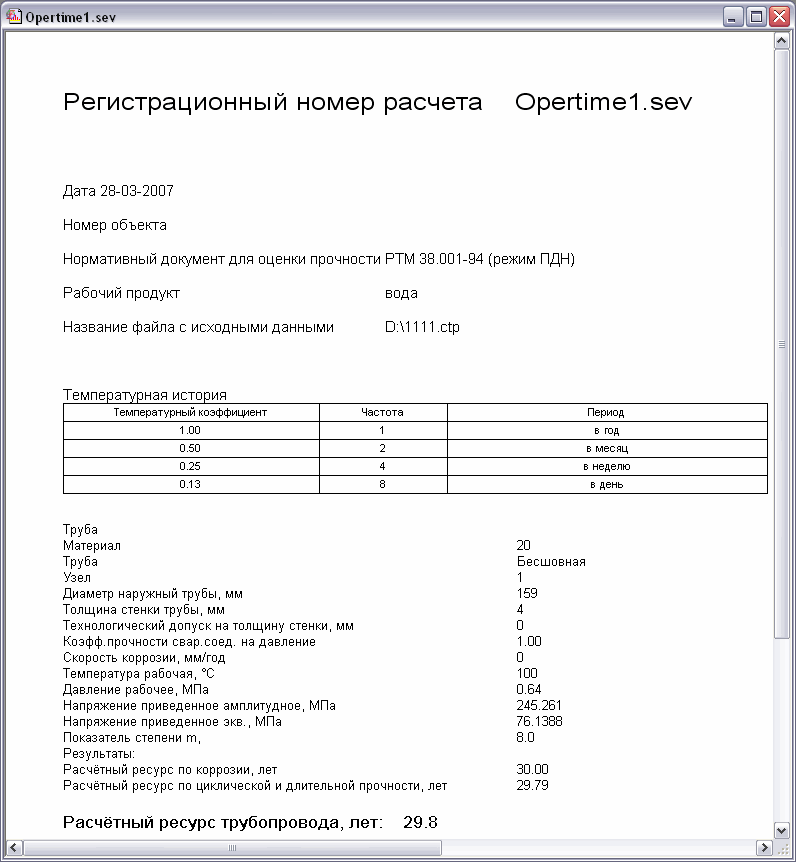
Fig. 10
Use toolbar icons to navigate between element pages (fig. 11)

Fig. 11
Filter displayed data with these toolbar icons:
 all elements
 elements within 10% of minimum service life
 elements with shortest service life